If you're releasing or using Electron apps on Windows, you'll sooner or later encounter your first native crash. A customer of yours is complaining that the app crashes – and you're stuck wondering what happened, unsure how to debug the issue from afar. In this short tutorial, I'll explain how you go from a mythical crash on a user's machine to looking at the offending line of C++.
By the way: You can do this with other people's Electron apps, too. I use this process below to debug Slack's native crashes – and you could too, if that's the kind of fun you're into!

Things you need
1) Windows Debugging native code is complicated enough, there's no reason to make your life more difficult by trying to do it on a non-Windows machine. Good news: If you don't already have one, Microsoft offers a free VM with Visual Studio and all required developer tools pre-installed.
2) Visual Studio You could use other tools, but Visual Studio is king here. If you don't already have it, you might qualify for the free Community edition. Alternatively, try out the VM explained above.
3) Crash Dump Your user can find it by opening %LOCALAPPDATA%\CrashDumps in Windows Explorer. It'll likely contain a few files – if your app is named MyApp.exe, your user should be looking for a file like MyApp.exe.13920.dmp. Have them send it to you.
4) Optional: Electron Source If you want to see the actual line of code that made your app crash in Visual Studio, you'll need to have the code. To be fair, checking out Electron locally is a pretty daunting task and takes multiple hours, so I'll explain an online alternative, too.
Debugging
Once you have Visual Studio installed, open your crash dump. Visual Studio will display generic information about the crash in the upper area of the screen and a list of loaded modules below. If your app is named MyApp.exe, you should see it and its version listed.
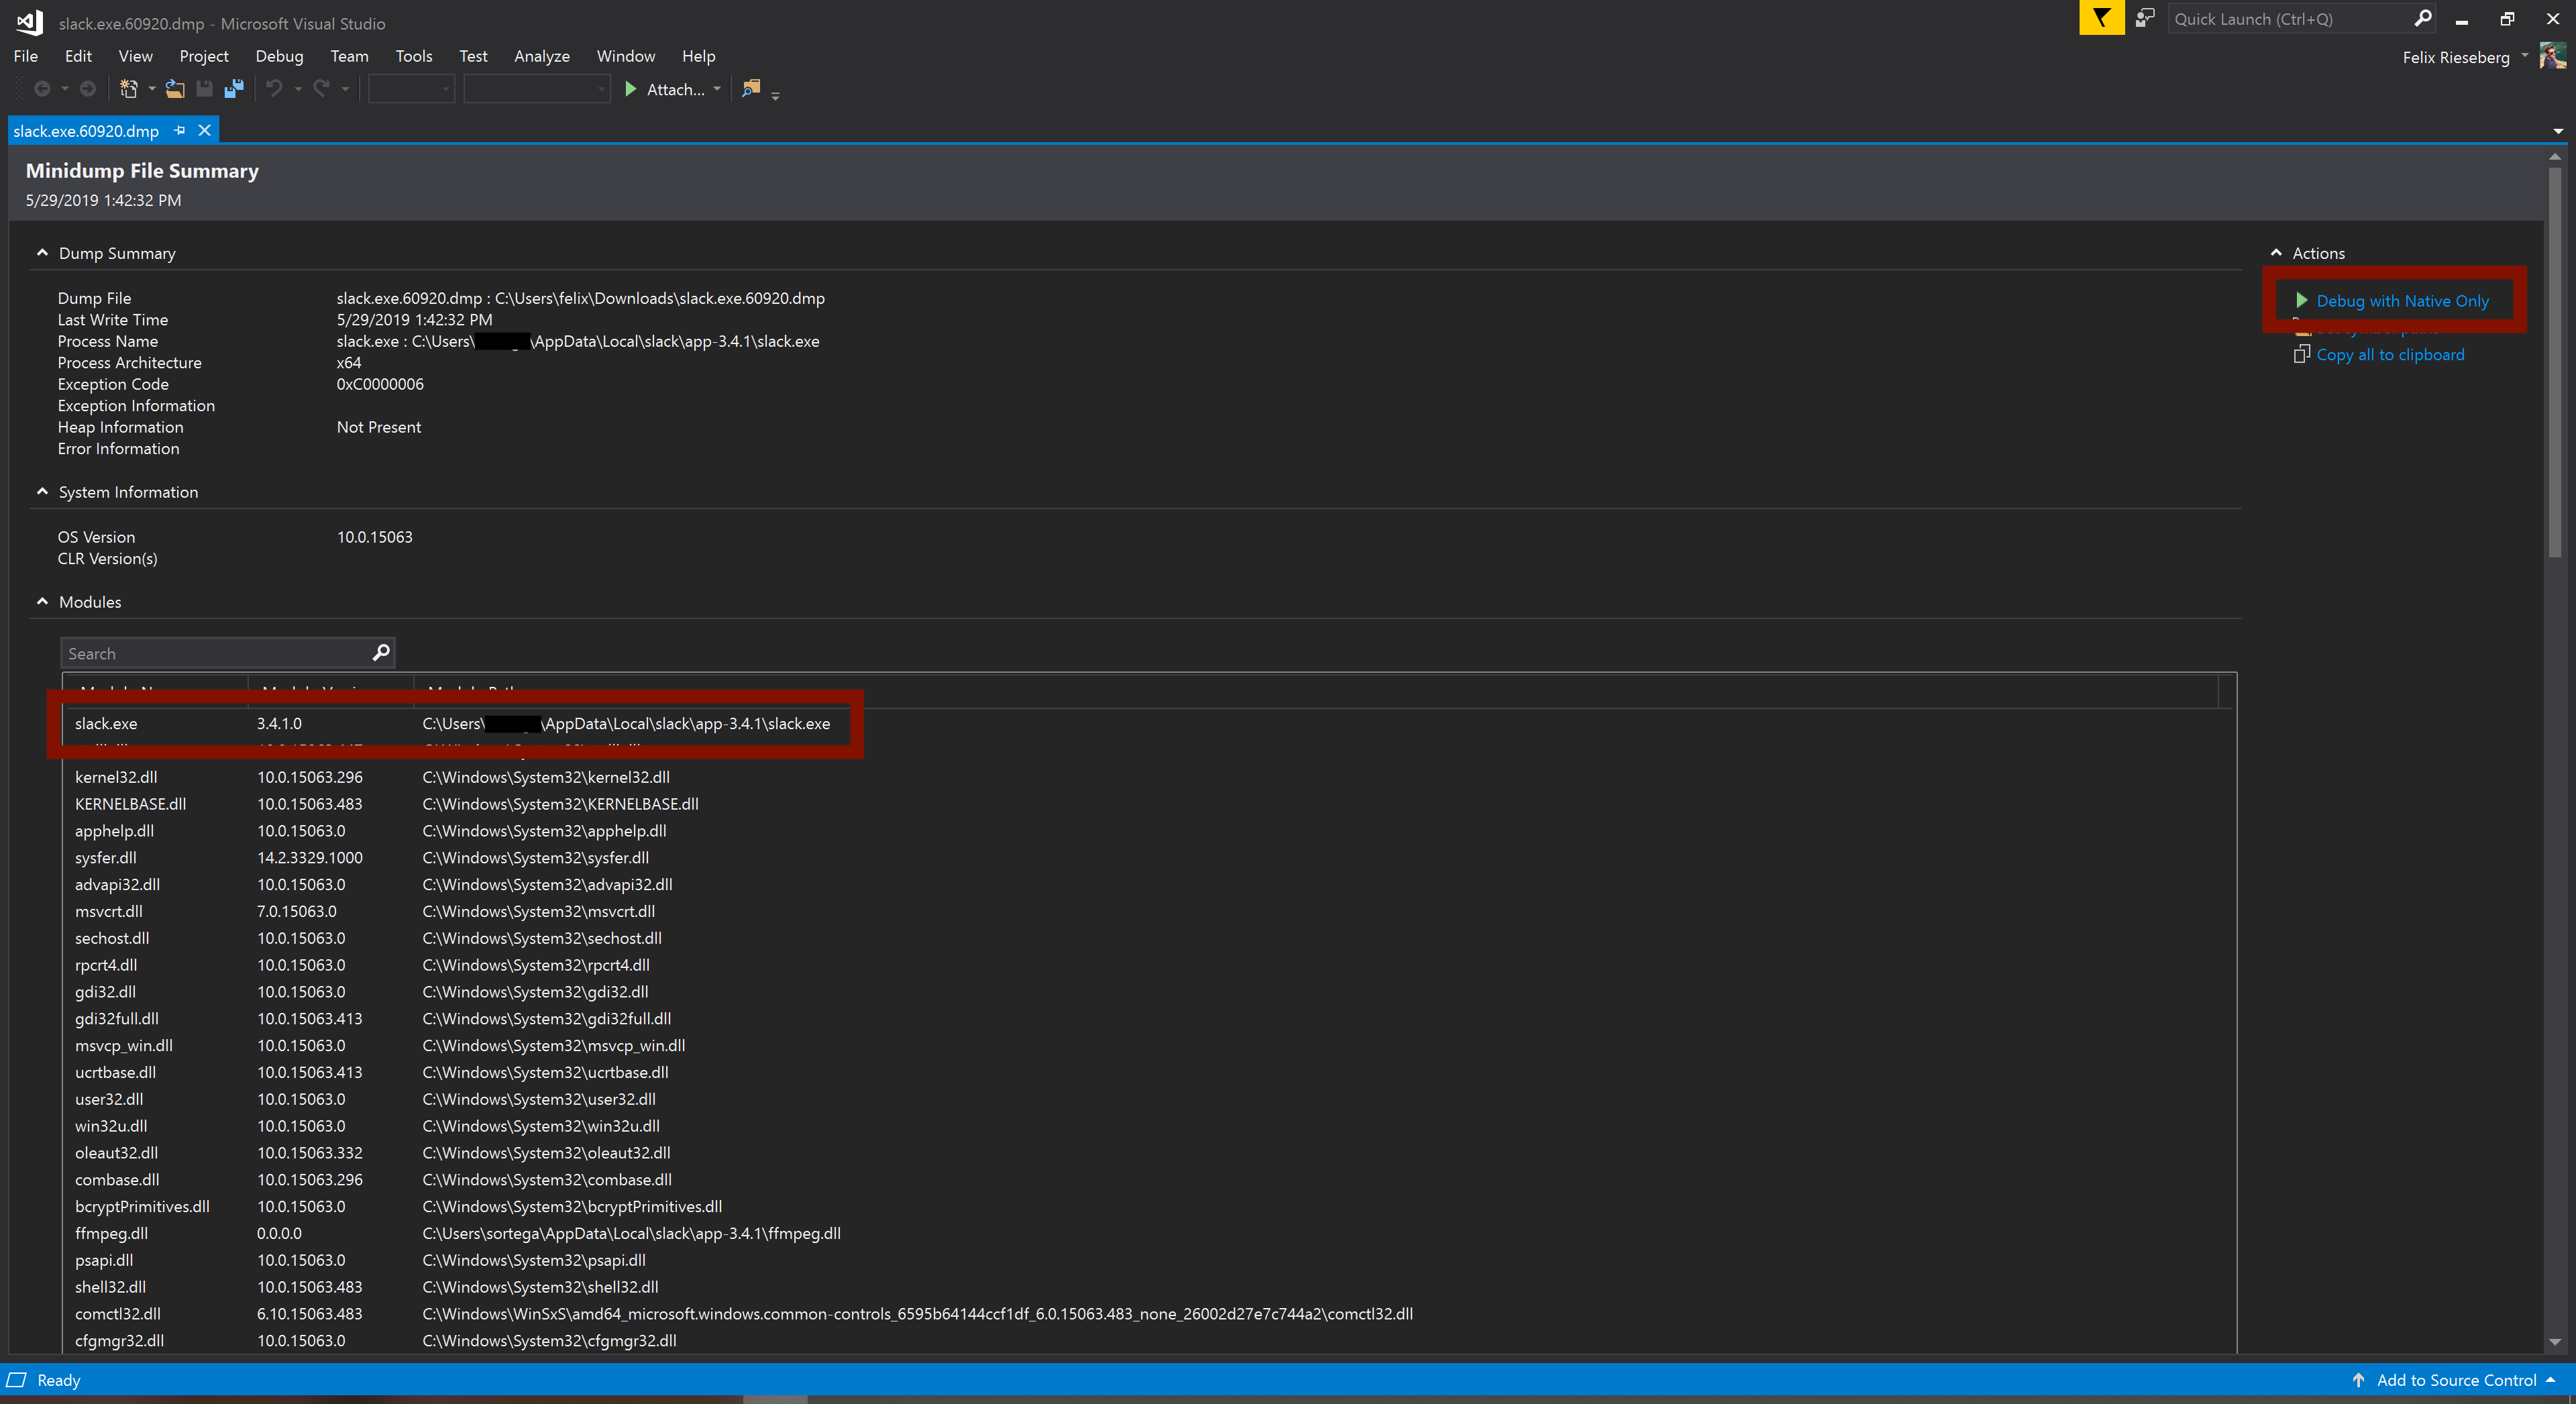
Armed with that information, we'll get two things: First, the same binary your user was using. If your user experienced the crash with MyApp.exe built for x64 in version 3.2.1, you'll need the exact same binary.
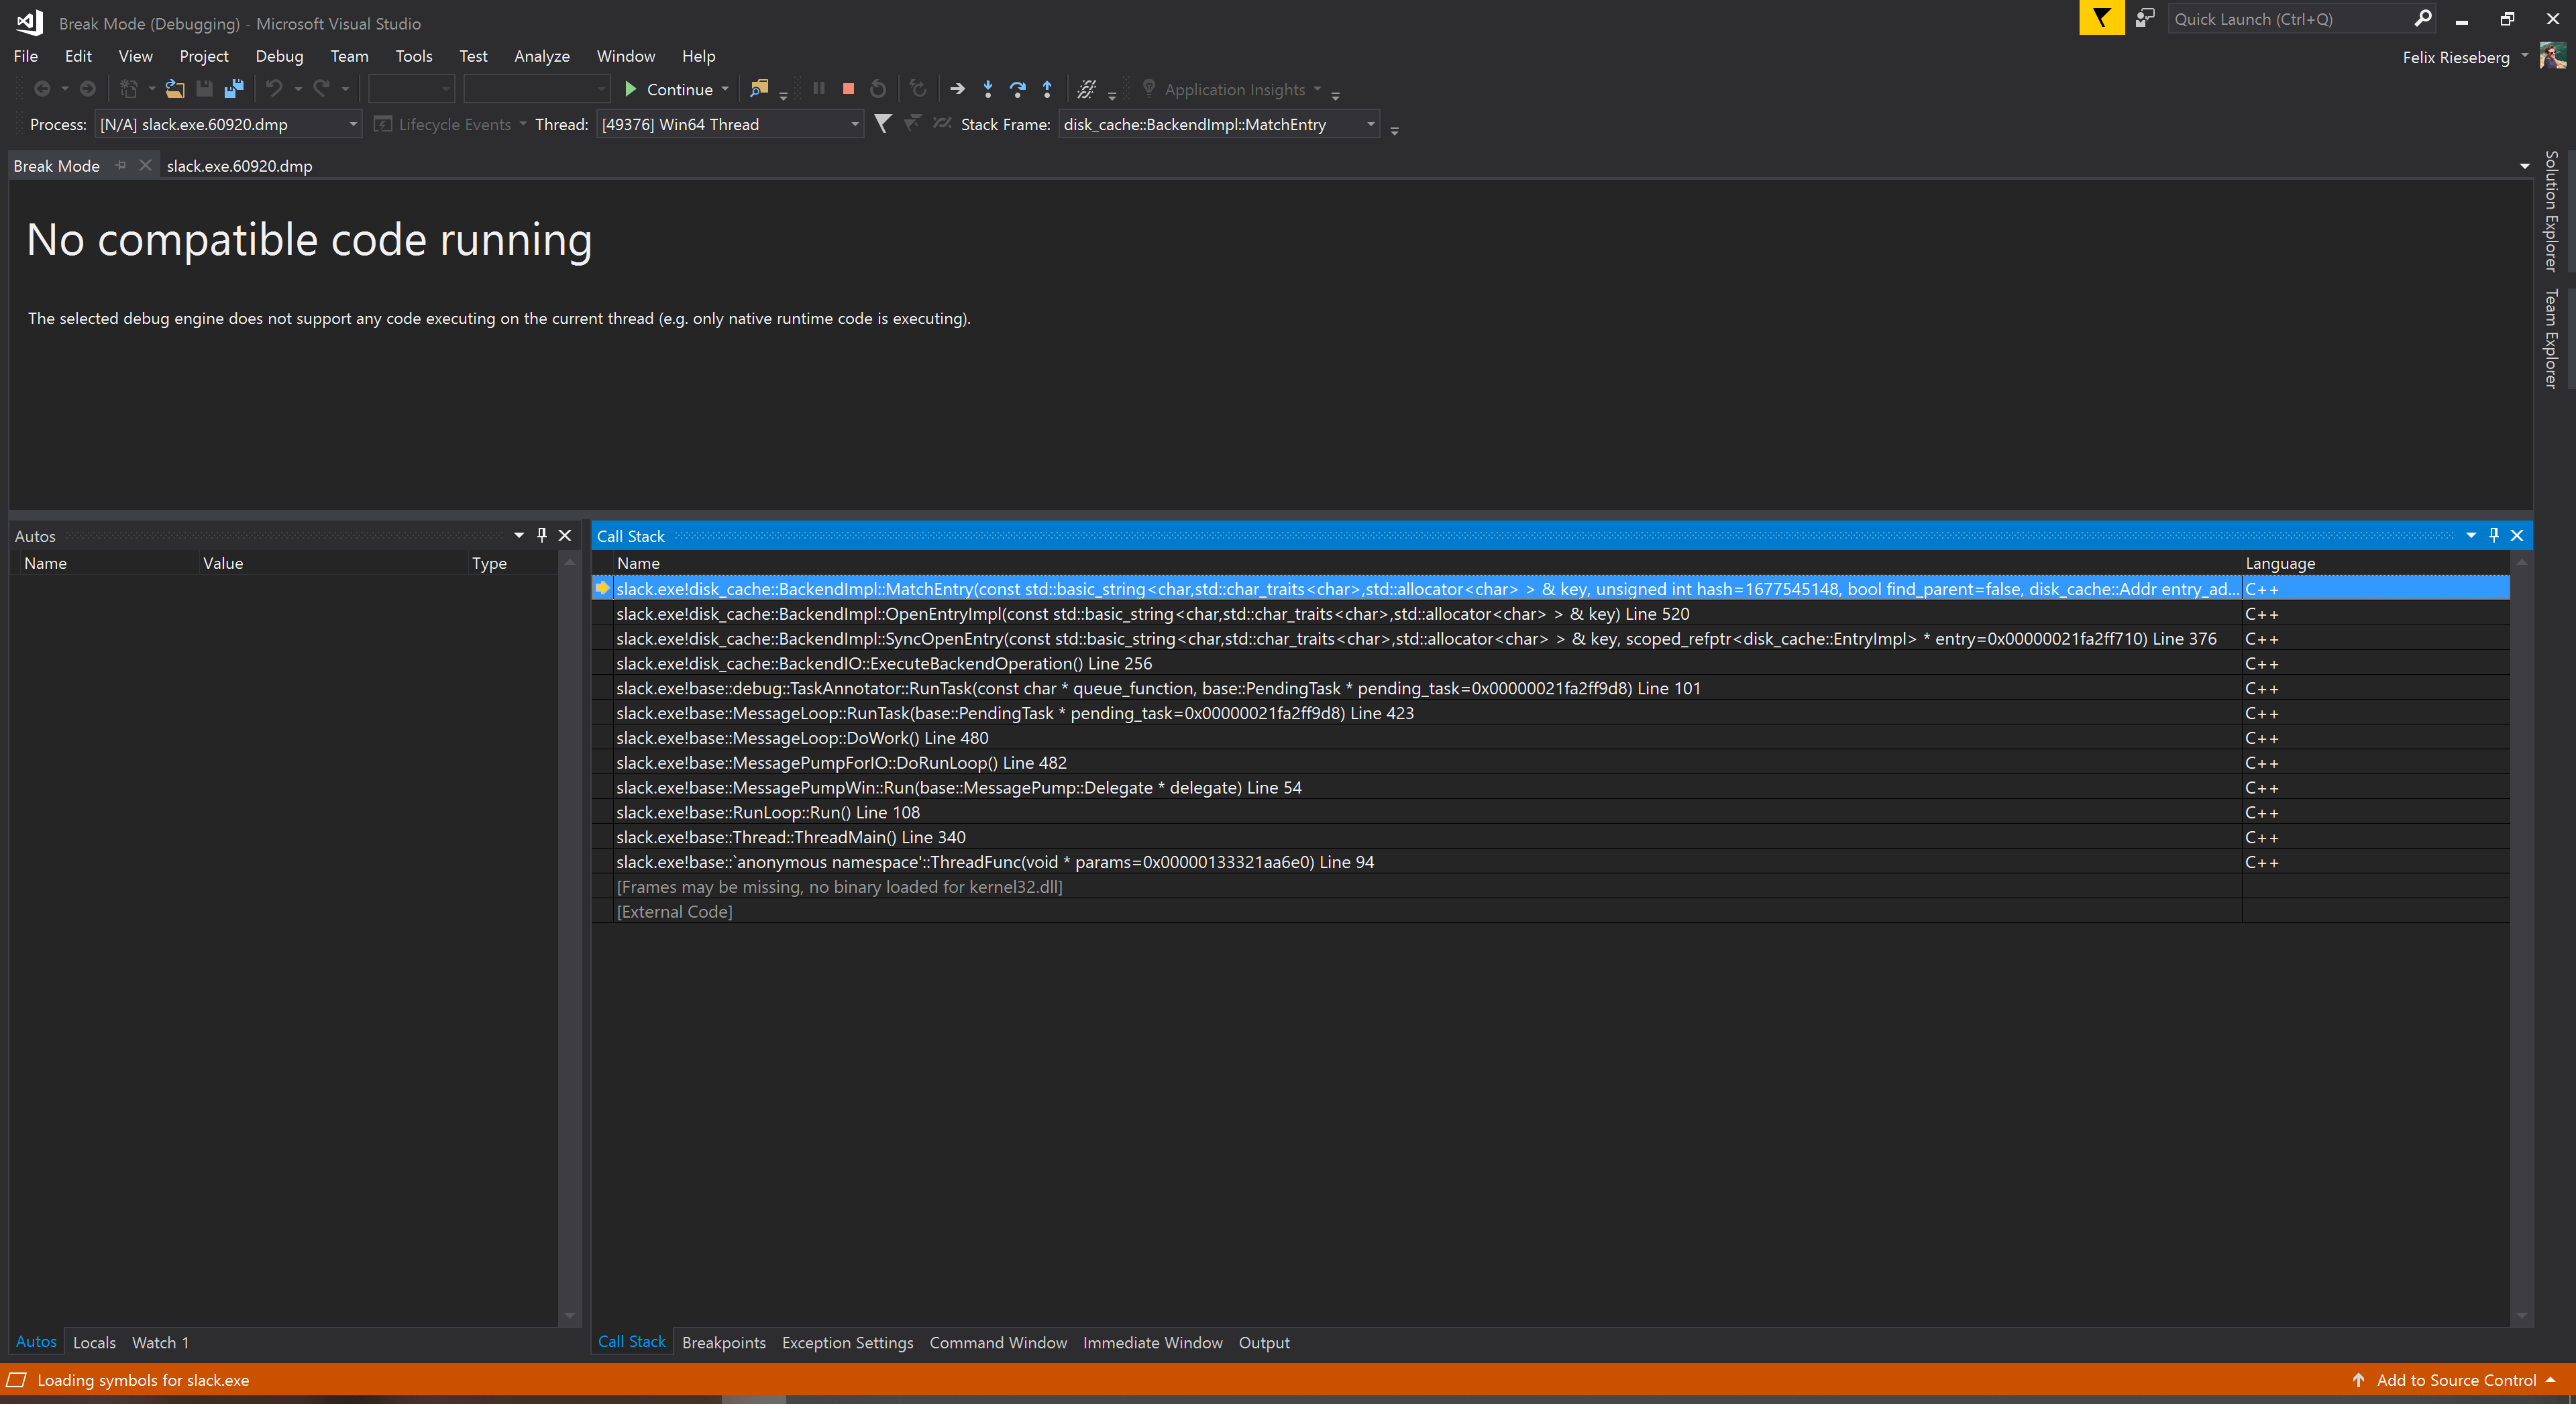
Next, click on the button reading Debug with Native Only. Visual Studio will now do its very best to debug the dump but doesn't have any of the required information. The information displayed for you is thus pretty sparse:
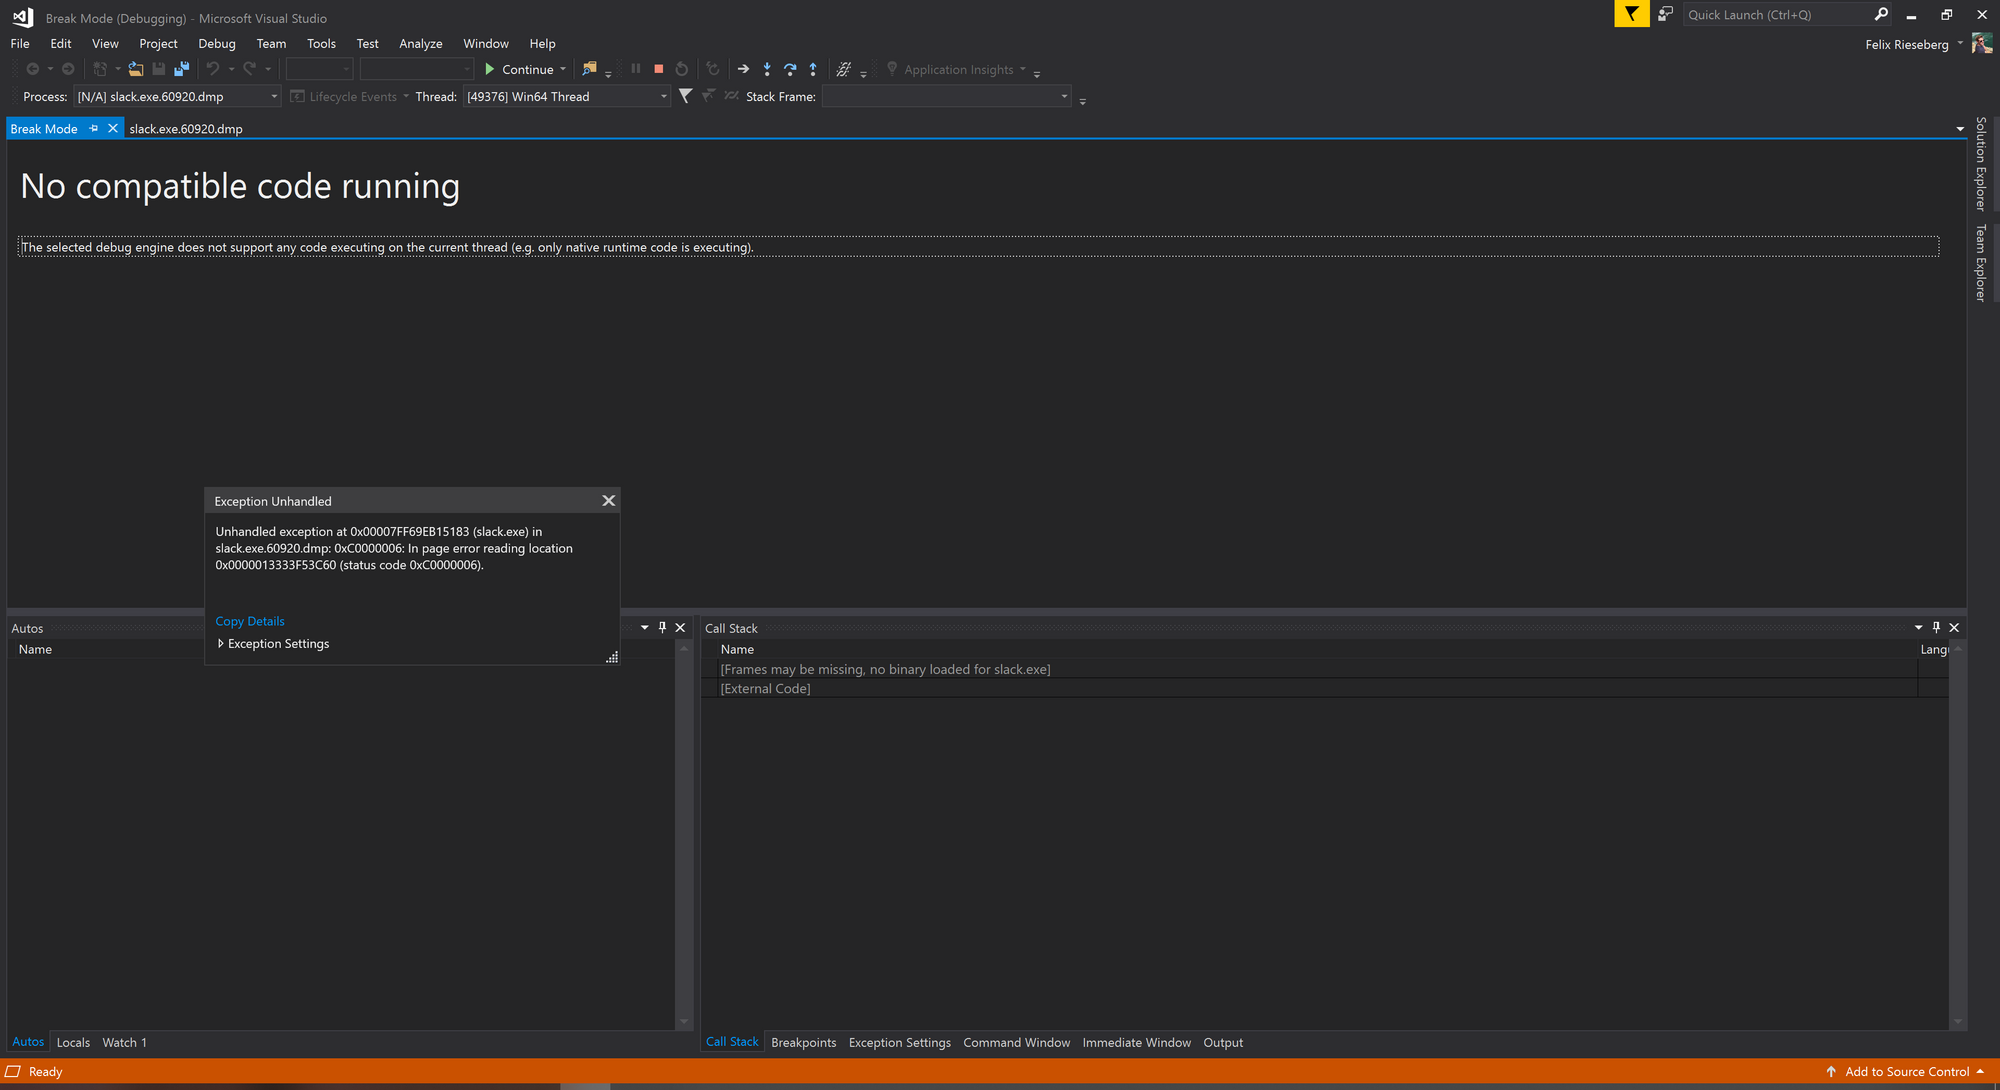
To help out, we'll tell Visual Studio where to find the binary. Open the Debug menu and select Windows. Then, click on Modules.
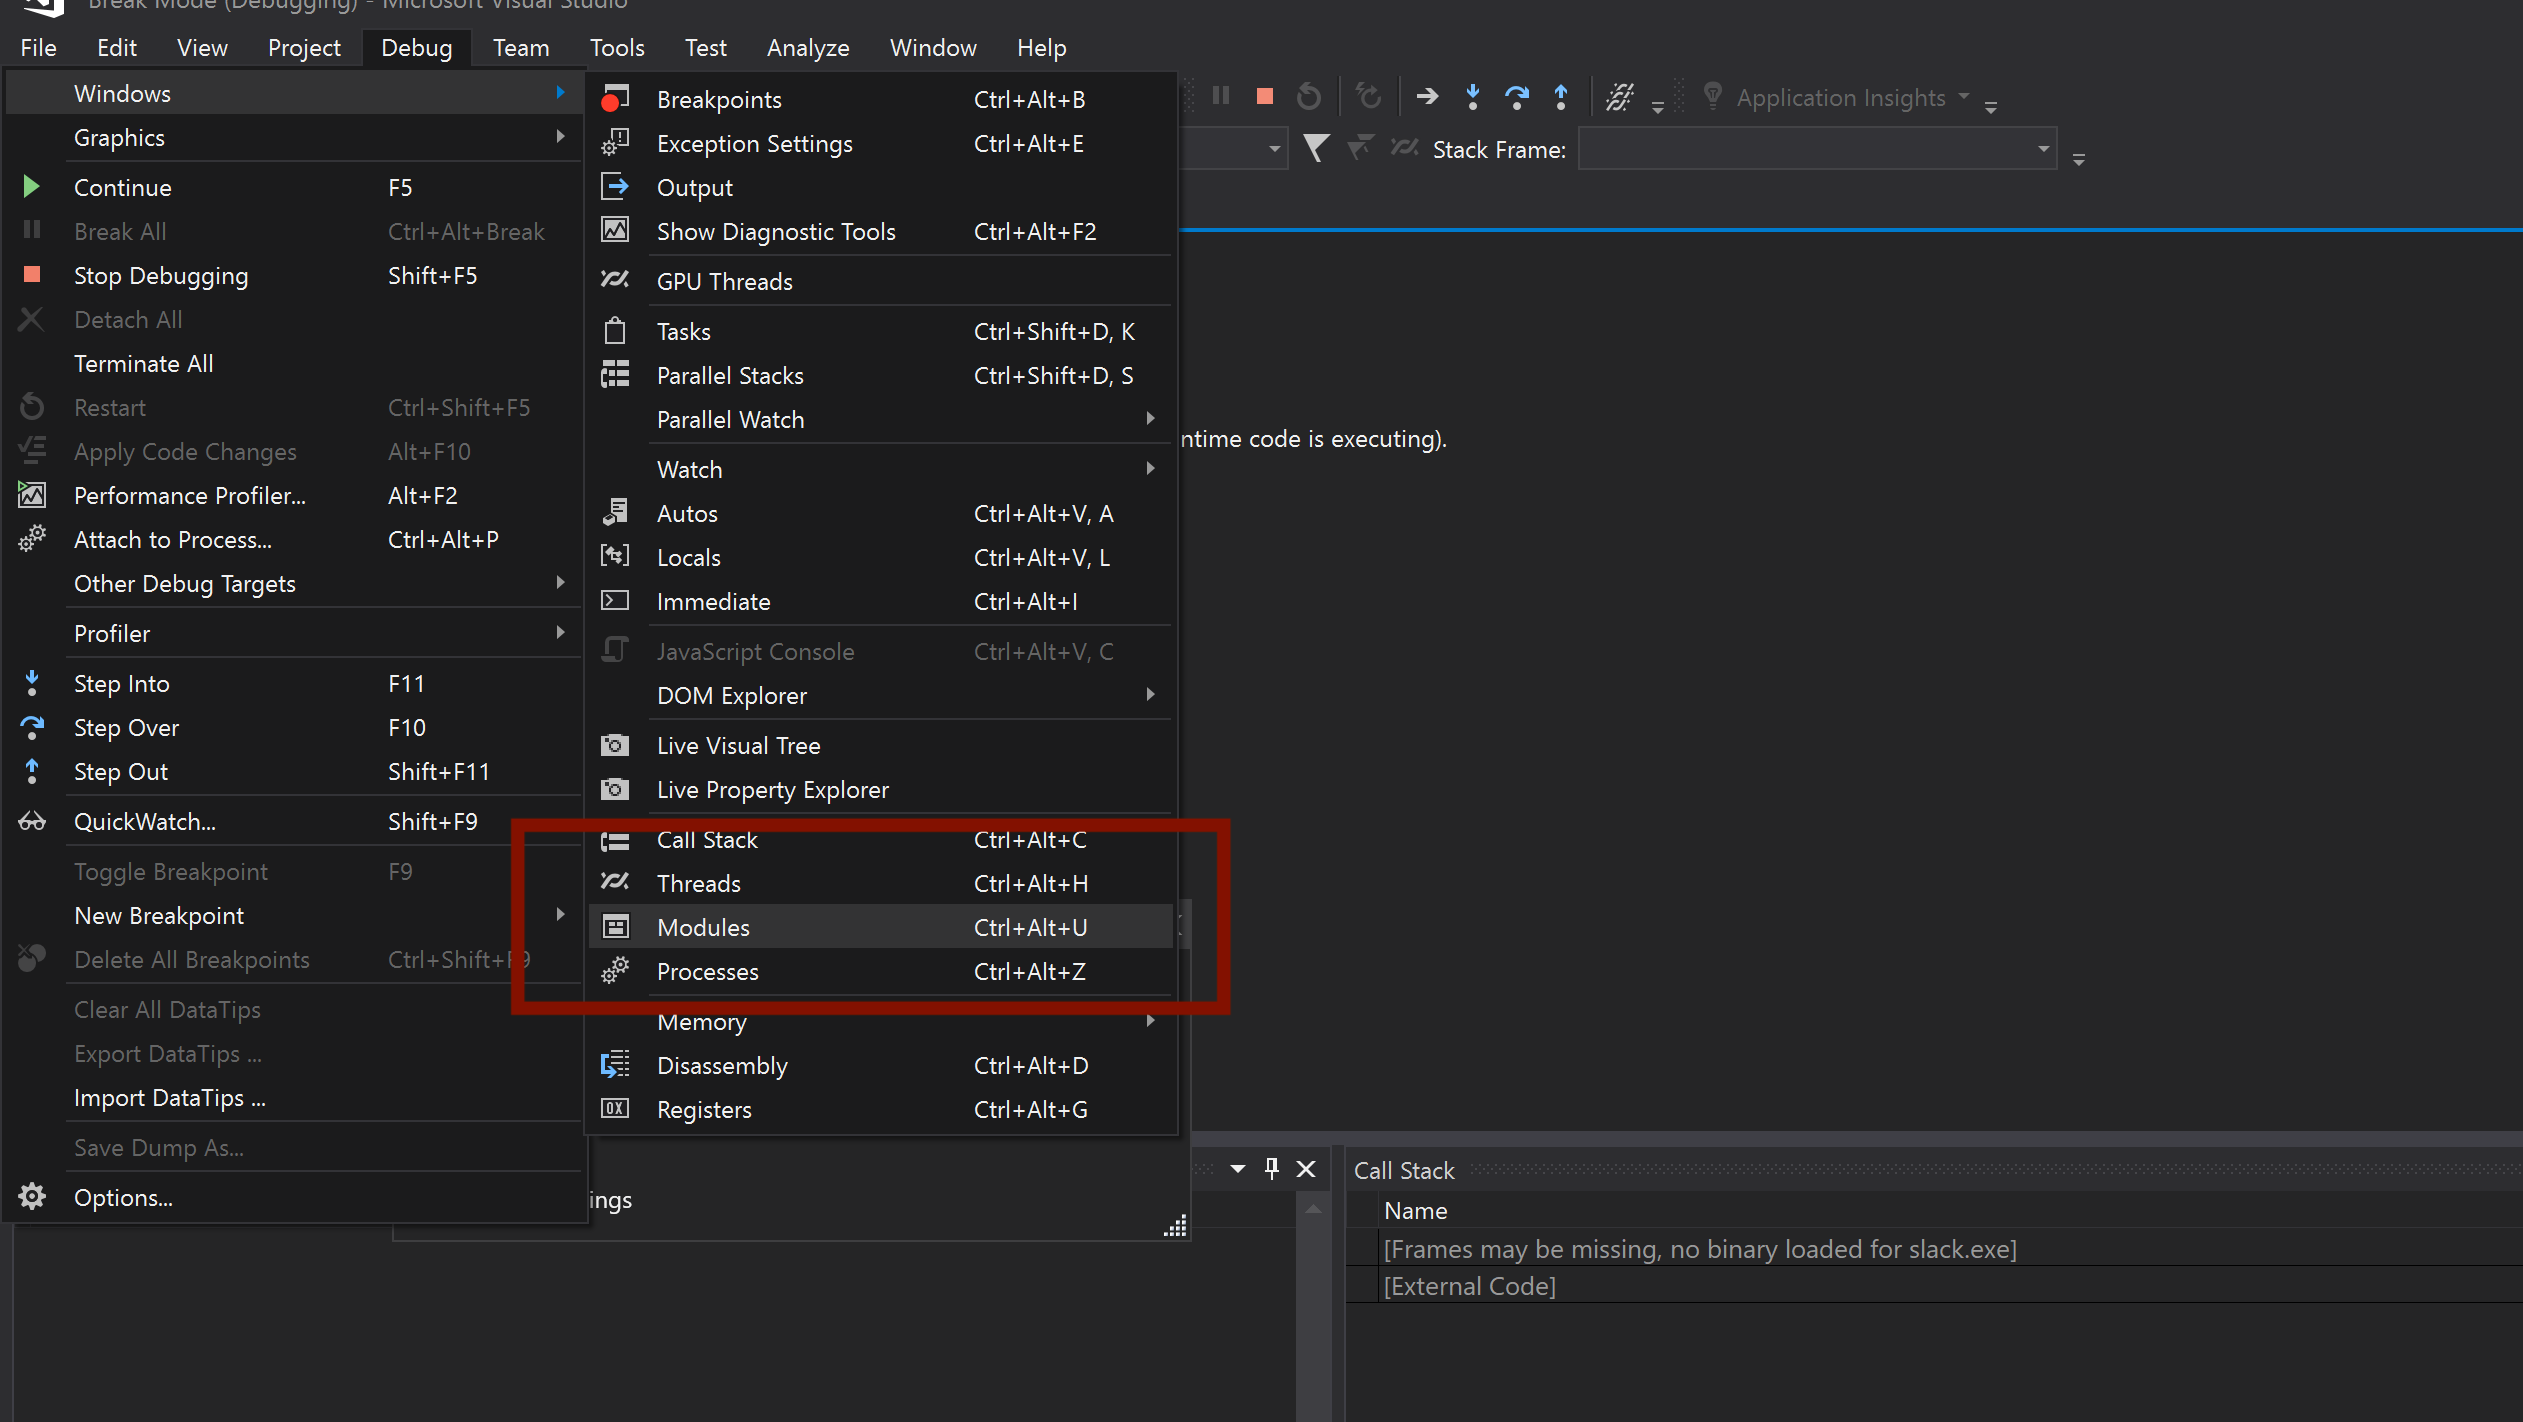
Visual Studio will now show you a list of all available modules. As you can see, I also didn't load any of the symbols for Windows – all jokes aside, it's pretty uncommon that you'll find a crash inside Windows.
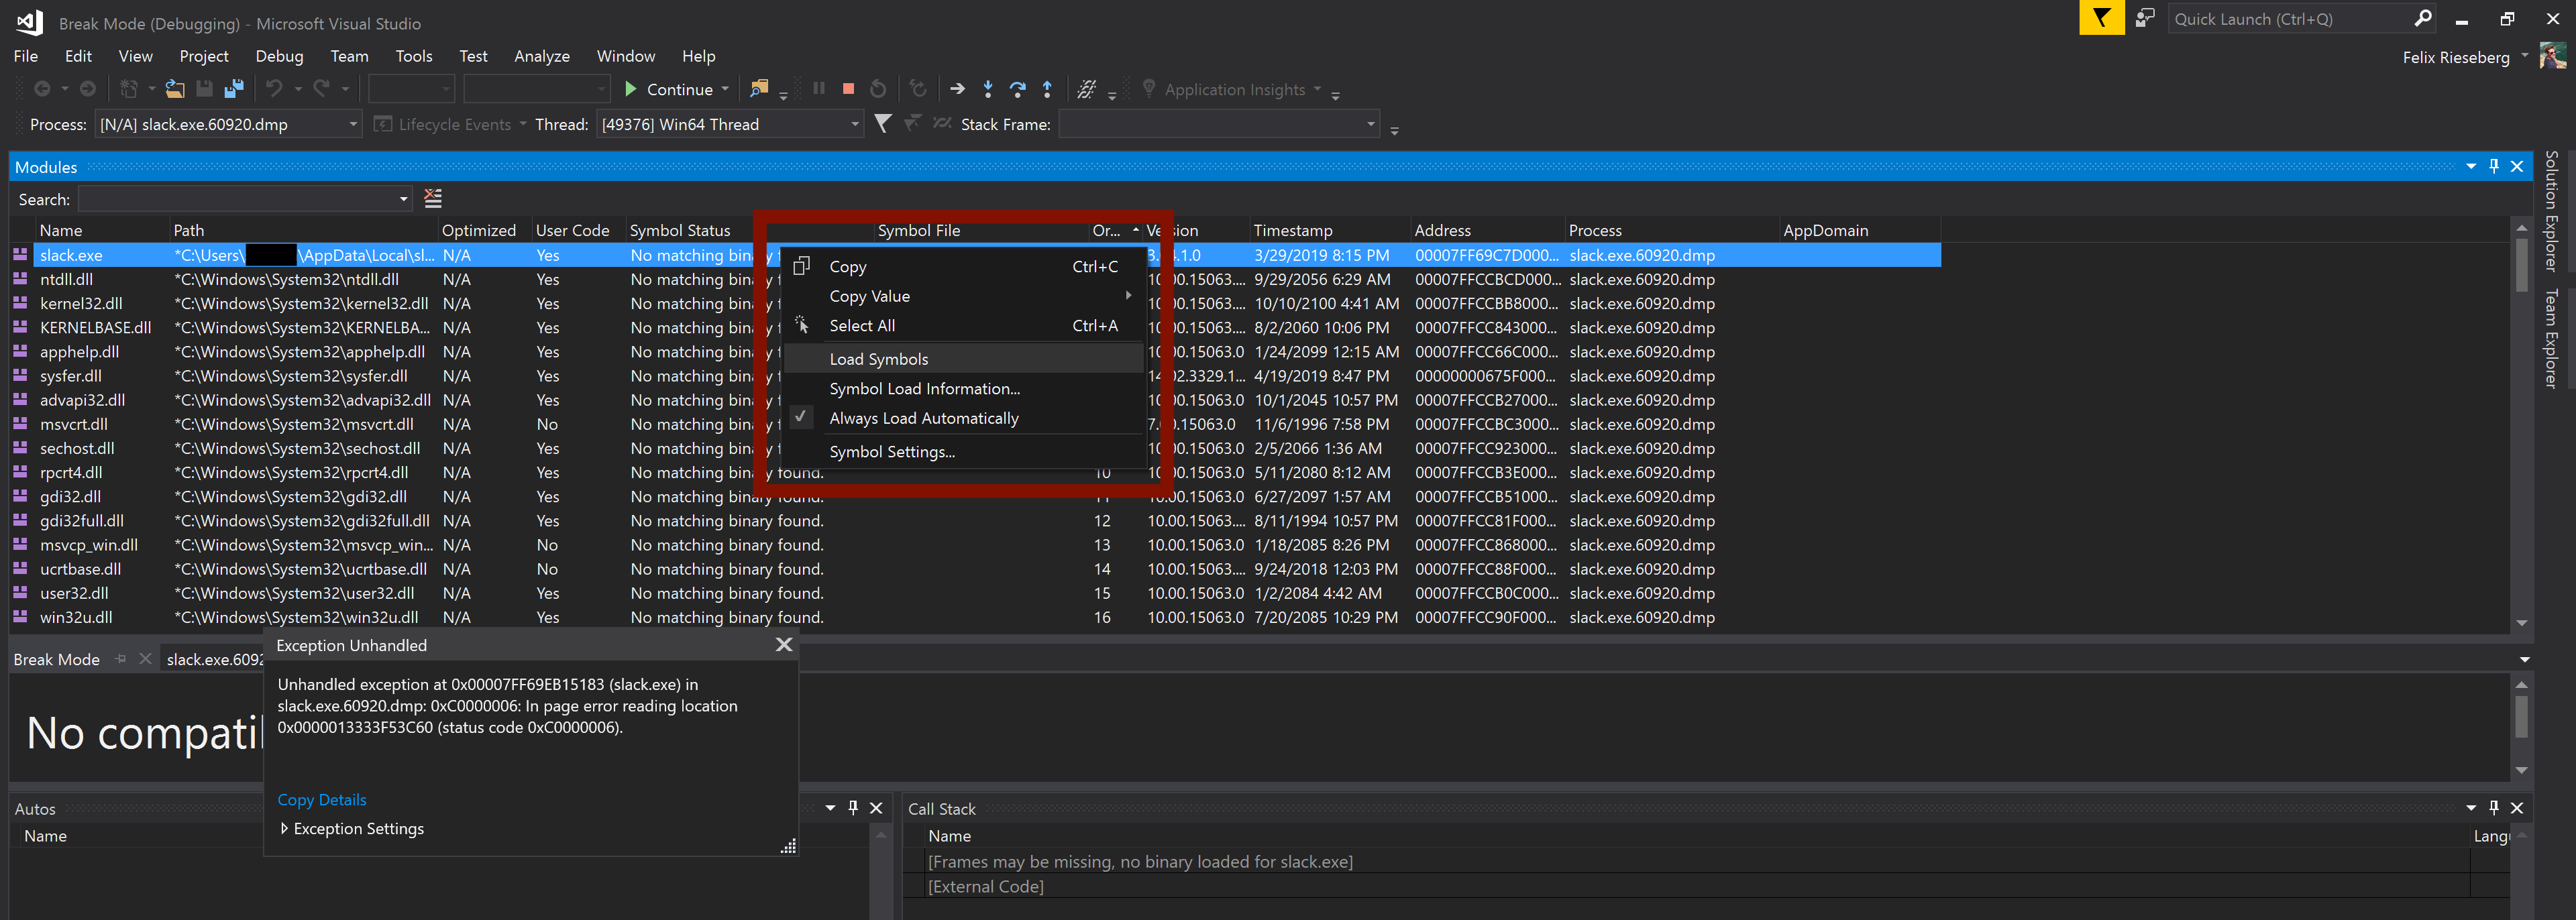
Right-click your app's name and select Load Symbols. A file picker will open, navigate to your exe. Chances are high that Visual Studio will find it as soon as you navigate the file picker to the right folder.
Visual Studio will now likely ask for electron.exe.pdb. That file is basically a map, linking the crash information to actual source code. Visual Studio supports two ways to load symbol files: You can either use an online symbol server, which will fetch symbols on the fly, or point it directly at a local pdb file.
If you want the online symbol server, use https://electron-symbols.githubapp.com as the address. I personally recommend going with the offline version, as it's usually so much faster. Head over to https://github.com/electron/electron/releases to find the Electron release you used. Amongst all the assets you'll find 500mb large pdb zip files. In my case, for the crash that I was debugging here, I needed electron-v4.1.3-win32-x64-pdb.zip. Download the file, unzip it somewhere, and select the correct pdb file in Visual Studio.
Now, Visual Studio will be able to tell you stack trace:
Alright, we know which sucker of a method is to blame for this crash. Let's try to actually read said line - double click the method you'd like to read. Visual Studio will pop up a dialog asking for the source file.
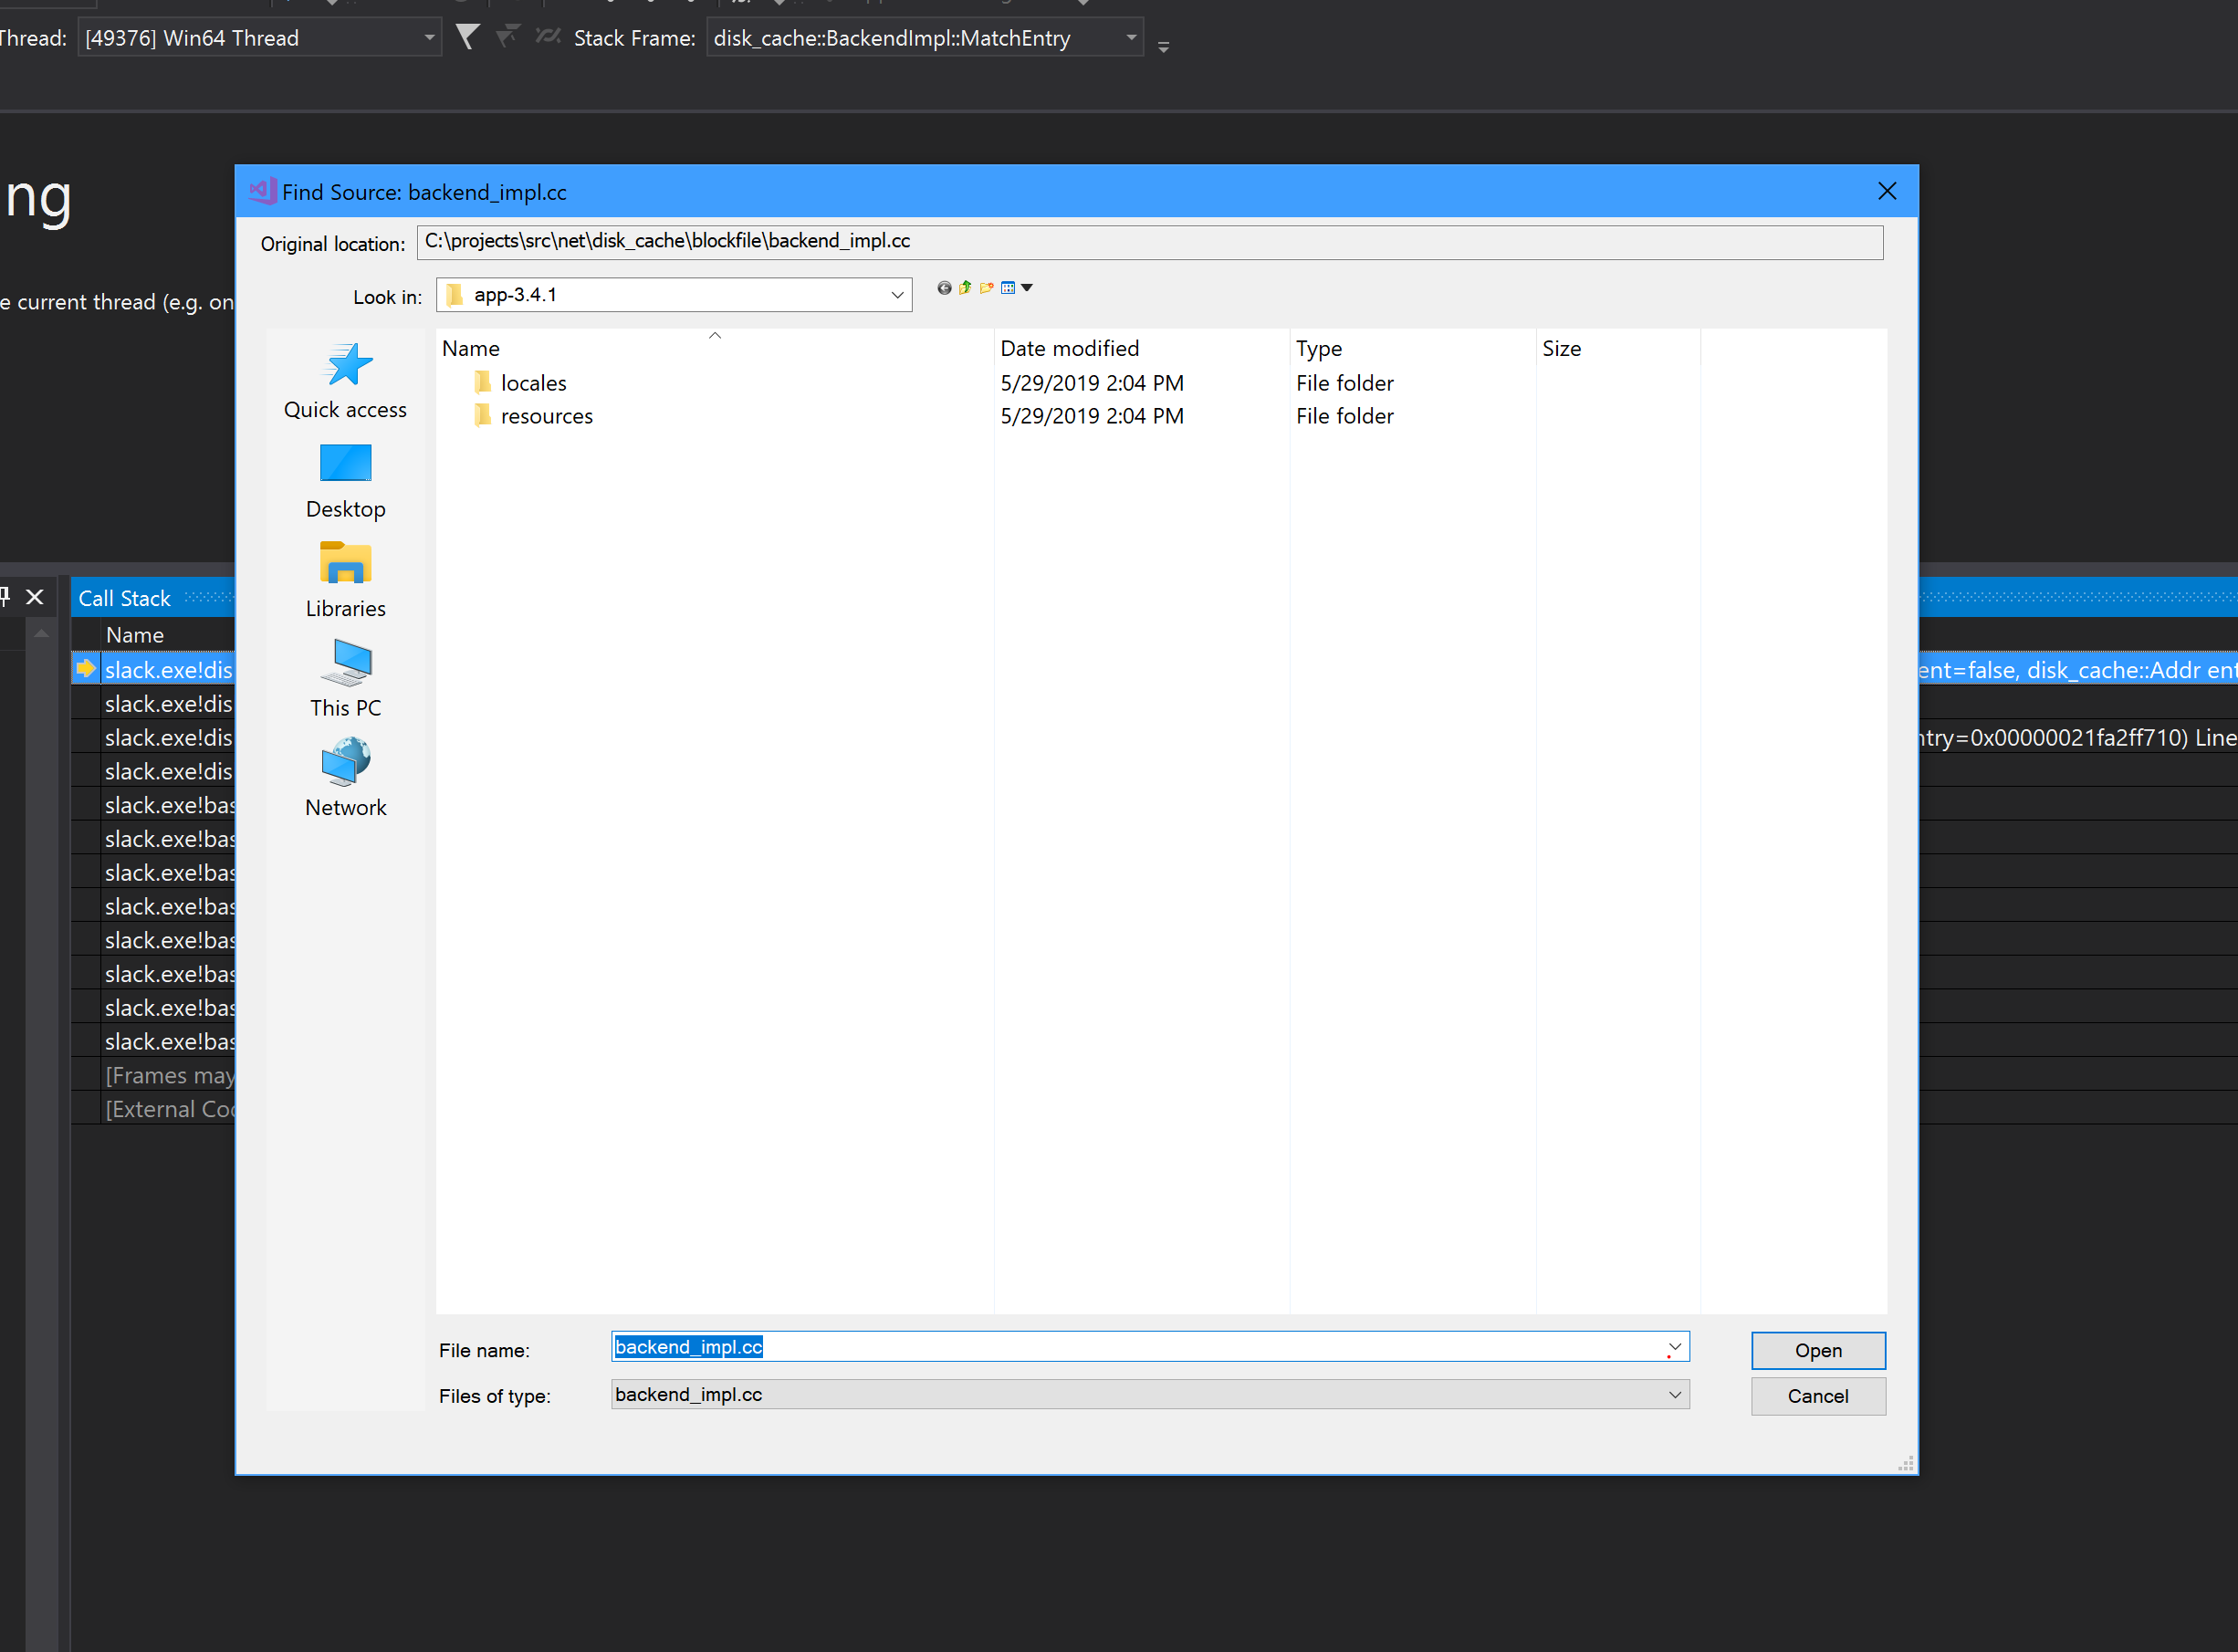
Notice how Visual Studio mentions the Original location on top of the file picker? Take note, because that's the file we're looking for. In this case, it's net\disk_cache\blockfile\backend_impl.cc, part of Chromium's disk cache implementation.
Option 1: Electron source on disk
If you happen to have electron/electron checked out on your local disk, make sure you've checked out the same version of Electron used in your app. Electron kindly maintains tags, so if you're using v5.0.2 of Electron, you can git checkout v5.0.2 in the Electron repo.
Make sure that you have not just Electron but also its dependencies checked out at the right commit (you might need to run gclient sync --with_branch_heads --with_tags), navigate to your Electron src folder, and Visual Studio should immediately find the right file. If it doesn't and warns you that the source file doesn't match what it expects, don't load it anyway - it'll likely be useless information. Make sure to find the matching source file.
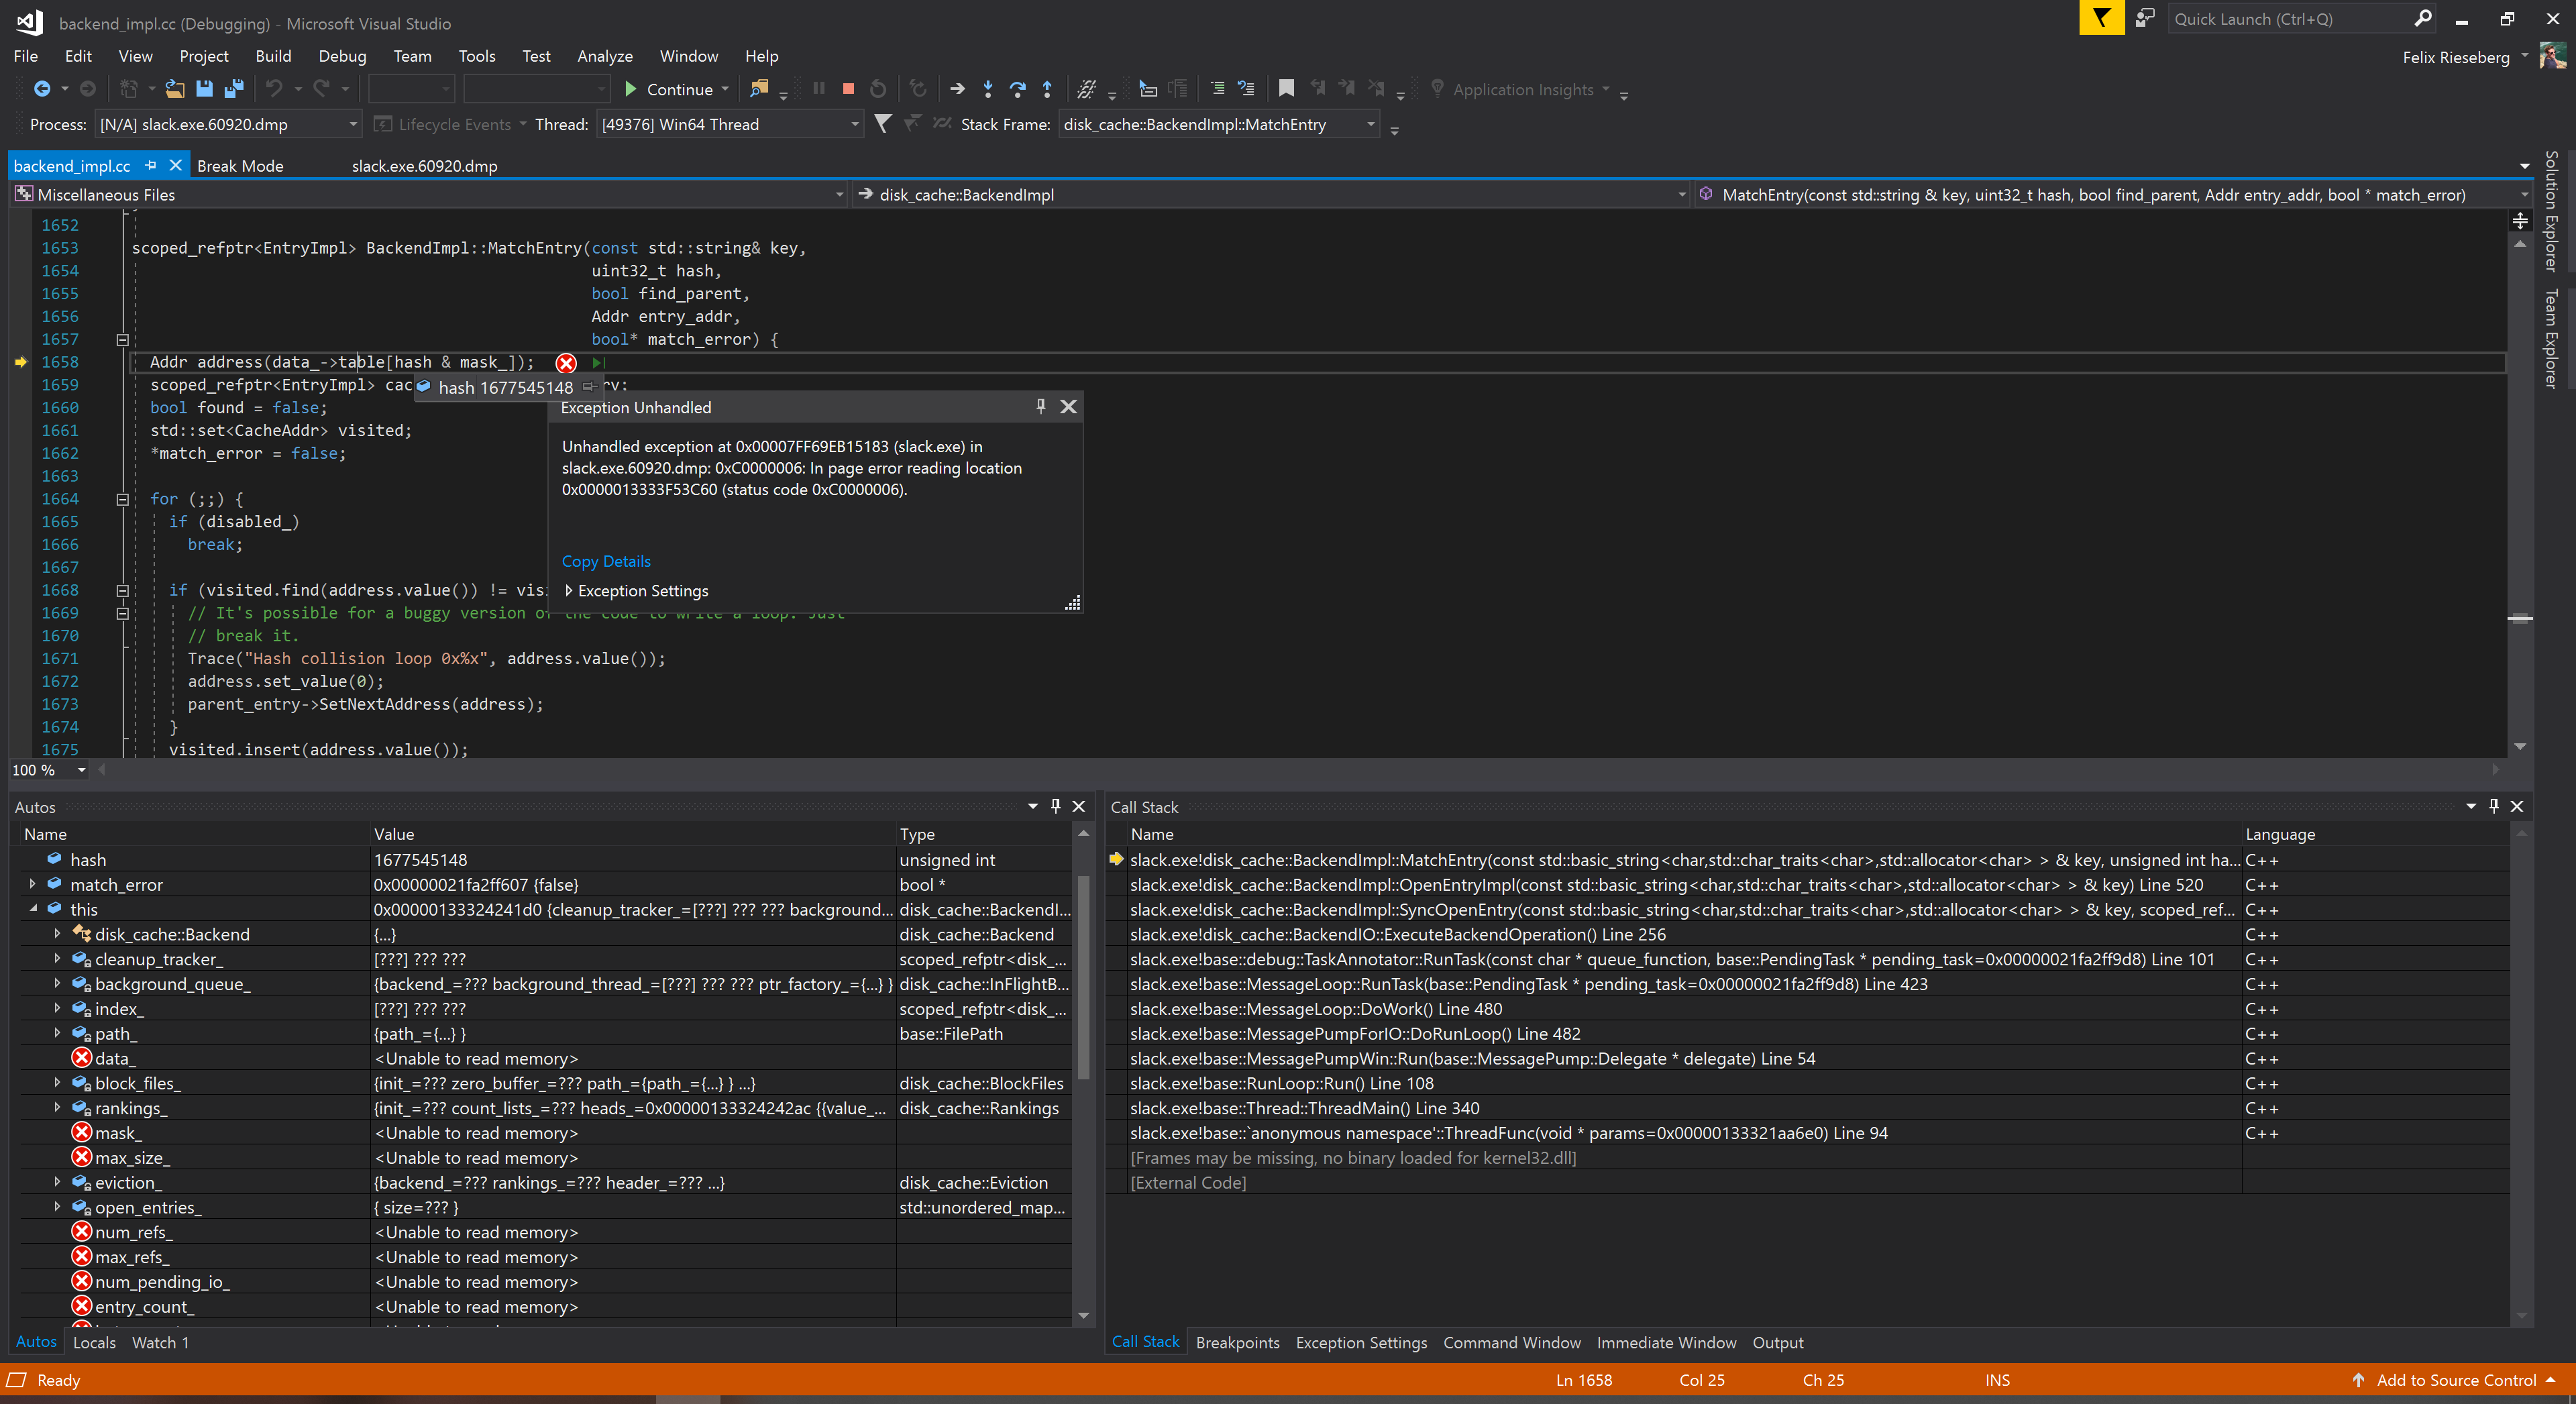
Then, once you've done so, you'll be able to actually debug the crash your user experienced right in the editor - as if you would have just hit a breakpoint.
Option 2: Online Source
Checking Electron out takes a while (multiple hours) and might not be worth the effort to you. You just want to see what the hell actually broke. Armed with the Original Location information, let's try to learn which module broke.
src/electron
If the original location was in src/electron, you'll be looking for the file in Electron's repo. Make use of GitHub's ability to take you straight to a file for a given git tag – if the original location is src/electron/atom/browser/atom_permission_manager.cc and you're using Electron v4.1.2, you'll find the correct file at https://github.com/electron/electron/blob/v4.1.2/atom/browser/atom_permission_manager.cc.
src/v8
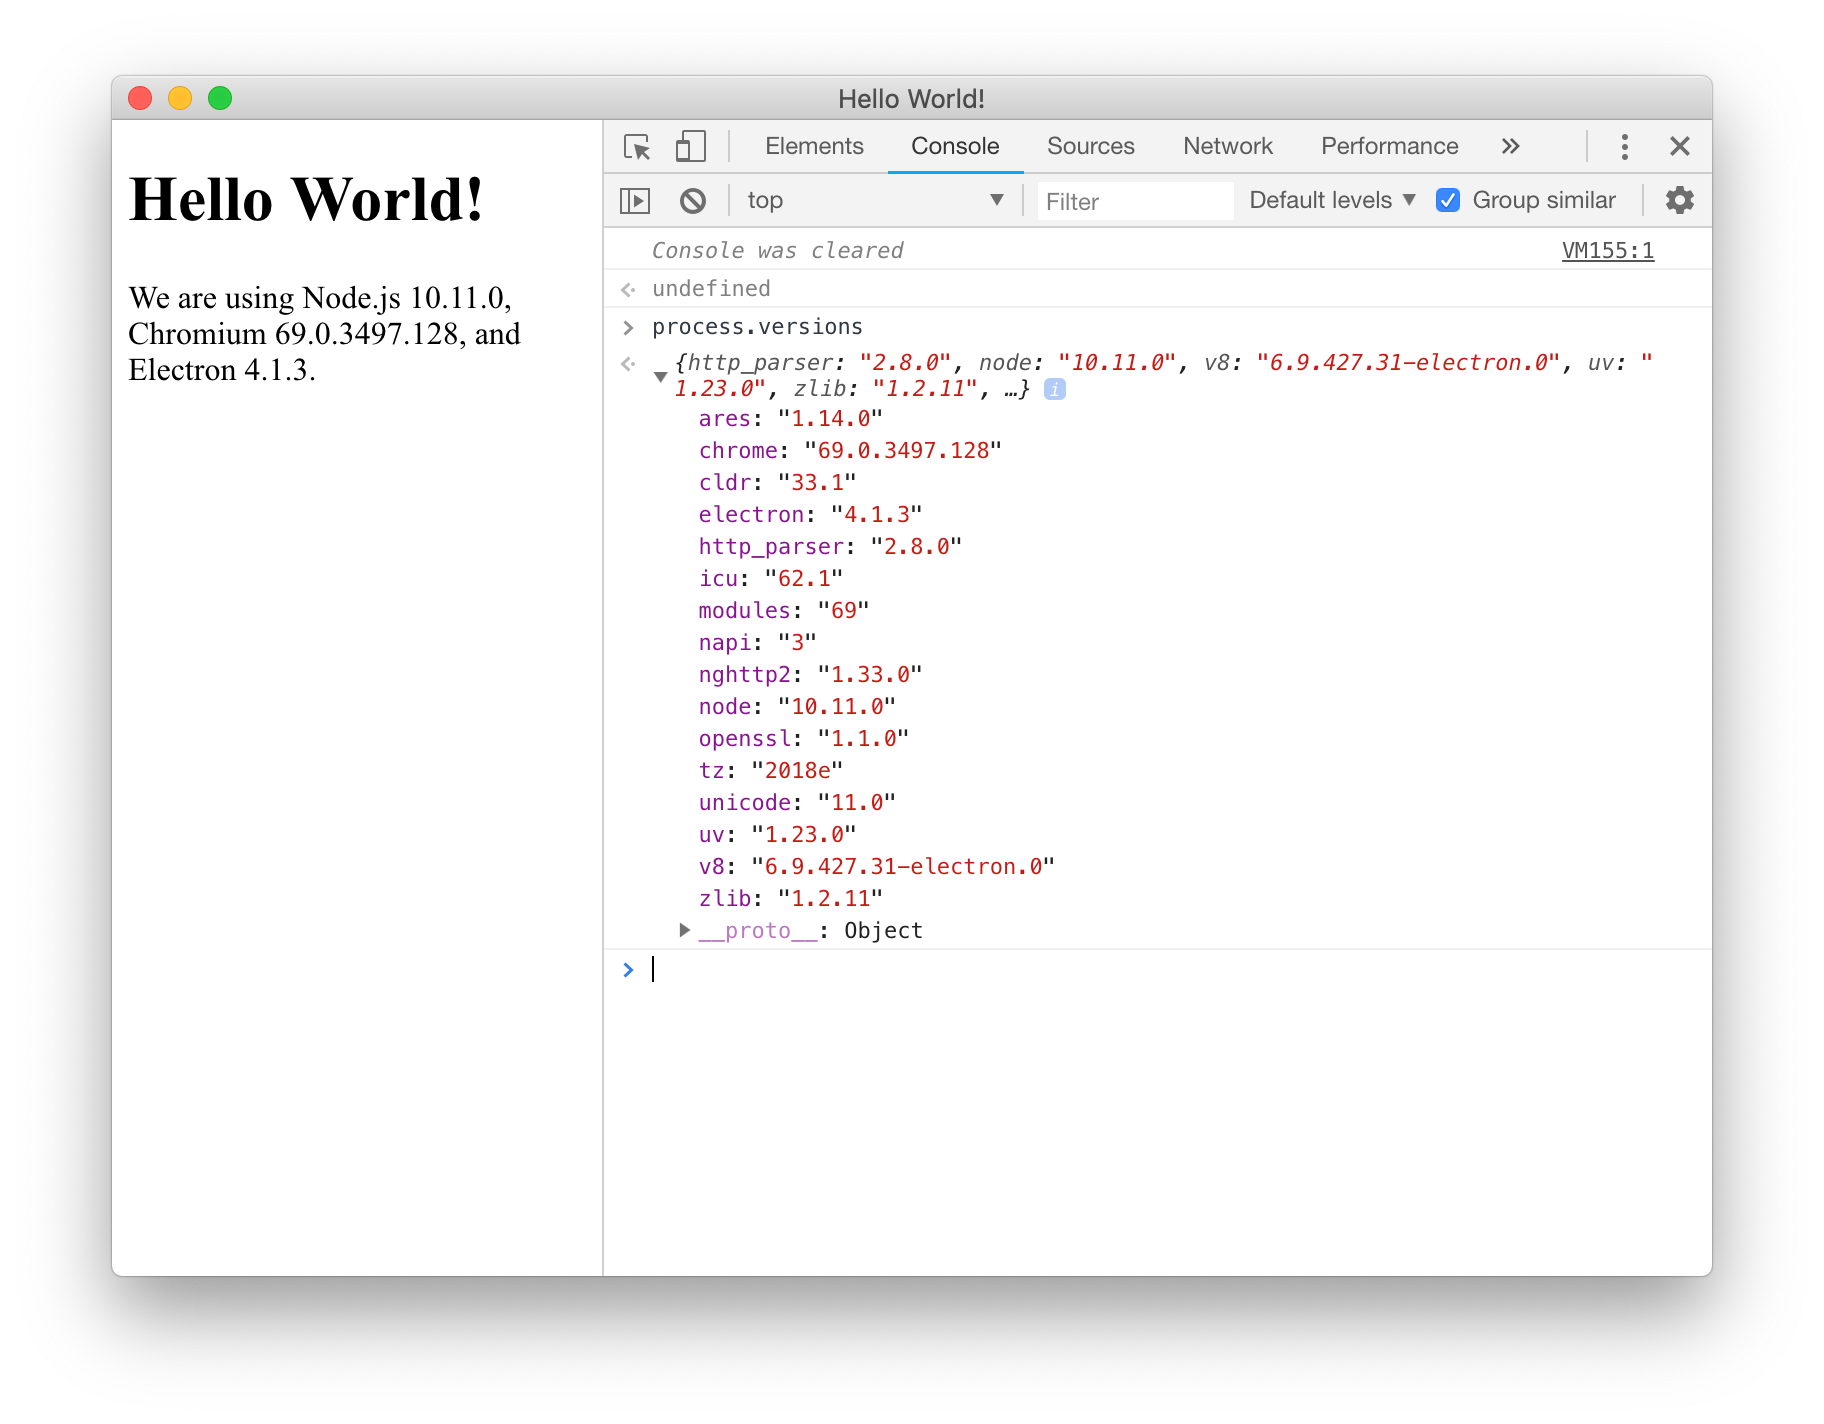
If the original location was in src/v8, you'll find the files in its repo. The v8 team doesn't work on GitHub, but they maintain an official mirror. To find the right file, you'll need to know the v8 version used in your version of Electron, which you can print to console by printing process.versions in Electron itself.
Electron patches its version of v8, so ignore the -electron part. In this example, we're looking for https://github.com/v8/v8/tree/6.9.427.31/.
src/**
In all other cases, we're likely looking for a Chromium module. Just like v8, the Chromium team maintains an official mirror on GitHub. Also just like with v8, you'll need to find the version of Chromium used in your Electron version. Looking at the screenshot above, we can see that for Electron 4.1.3, the Chrome version is 69.0.3497.128. Thus, we're looking for https://github.com/chromium/chromium/tree/69.0.3497.128/.
Let's find that file
Since we know our original file location, we also know that the file to blame lives here. In Visual Studio, hover over the line in the Call Stack to see the line number printed at the very end. In my example, it's line 1658.
What now?
Now that you found a native crash, the whole Electron maintainers community would be thankful for a bug report. Since you already did the work of finding the offending source code line and the crash reason itself, the active maintainers will be super thankful. Even better: If you went through the labor of finding the source file online, you can link to it in your issue!